Mississippi Canyon Structural Model
This example illustrates how StructureSolver analysis can create value when analyzing large extensional growth faults, such as those found in the Gulf of Mexico and other passive continental margins. In such systems, the fault traces themselves may be well imaged using modern seismic data. Stratigraphic correlations may be well established from well control in the shallow section but unknown in the deeper section. Such systems often have very large displacements and interpreters quite often underestimate the amount of growth in the deep section.
In this example, StructureSolver is used to confirm the upper level stratigraphic correlations and to confirm and refine the fault shape. The combination of convex and concave curvatures on the fault provides significant geometric constraints. After this is done, a good estimate of the deeper stratigraphic correlations is readily obtained.
In some sections we have studied, there was very early salt movement in the core of the extensional growth structure. In such cases, careful analysis of discrepancies between the deep modeled and observed geometries can help you estimate the amount and timing of salt movement.
Step-by-step Sequence of Analysis
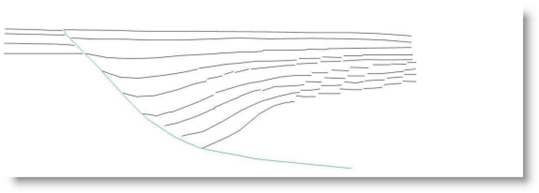 Import image of depth converted seismic interpretation; in this case a Mississippi Canyon growth fault from Xiao and Suppe(1991). Note the overall rollover together with “reverse drag” near the fault. The top four surfaces correlate on the footwall and hangingwall of the fault. The deepest five hangingwall surfaces have not been interpreted on the footwall side of the fault.
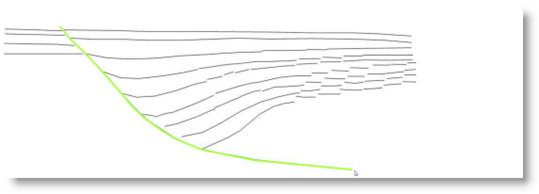
Digitize fault trajectory in StructureSolver – assuming that the existing interpretation is correct (which will be confirmed).
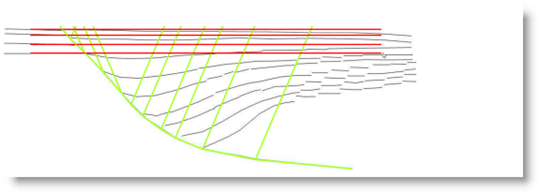 Add the uppermost four undeformed uppermost surfaces at their footwall levels. The synthetic and antithetic shear surfaces are automatically displayed.
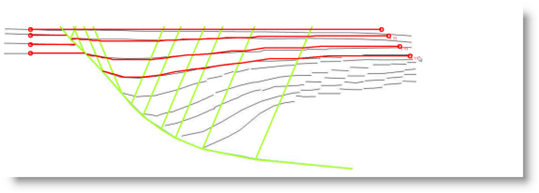 Stretch the hanging wall layers by a constant growth factor by dragging the deepest surface with the cursor. The model geometry conforms very well with the observed shapes, confirming that the fault shape is indeed controlling deformation. The main rollover is caused by the concave bends on the fault, the “reverse drag” by the small convex bends.
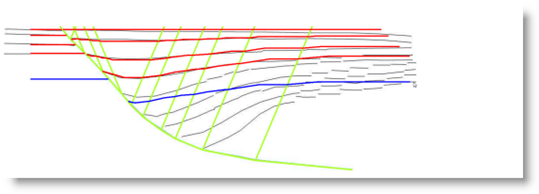 Add a surface corresponding to the deepest hangingwall surface. By default, it is assumed that the reference thickness of the overlying layer is the same on the footwall side of the fault (no growth). Because the structure does not match this assumption is clearly incorrect.
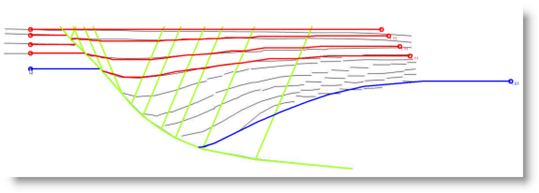 Match the deepest structural surface by dragging the footwall surface upwards, thereby reliably establishing the footwall correlation of the deepest hangingwall surface.
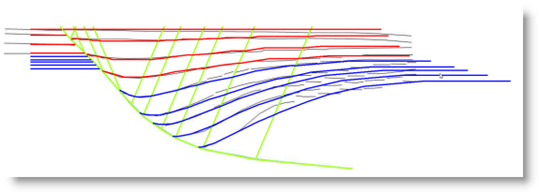 Add intervening surfaces that match the hanging wall cutoff. The model is now complete and accounts for about 90% of the observed structure. The fault trajectory and deformational mechanism is confirmed and deeper correlations established.

