Integrative Structural Analysis: Northern Peru
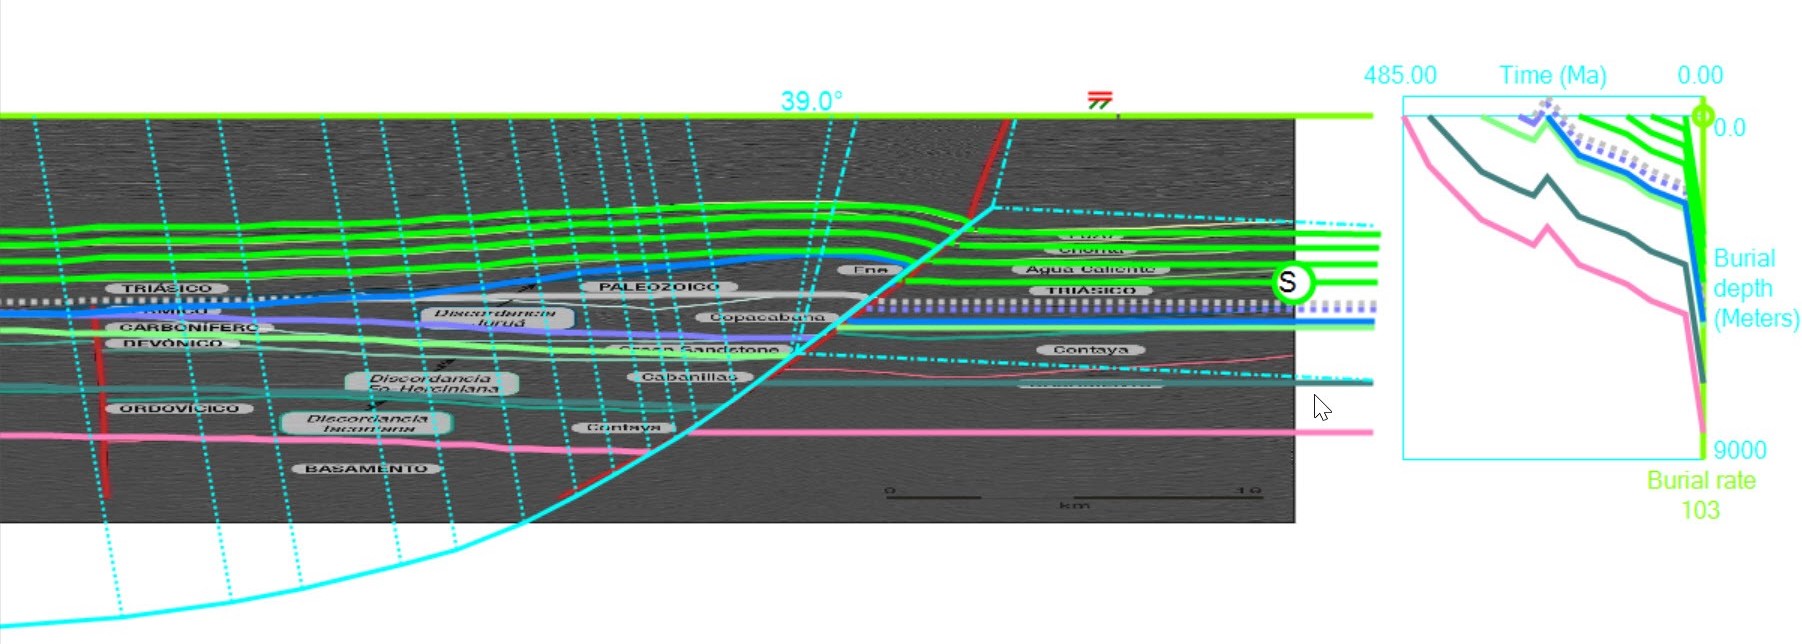
A variety of structural analysis techniques are applied to an inversion structure in the sub-Andean Ucayali basin, previous interpretations from the Ucayali/Ene Basin Technical Report, PARSEP Interim Report (Wine et al, 2002). Using sequential restoration, restricted trishear fault propagation modeling, and erosion modeling, we create a kinematic forward model of inversion consistent with the 2D upper fold shape and angular unconformities associated with erosion.
Sequential structural restoration reveals early rifting followed by two-phases of contraction that are separated by a period of erosion/deposition. Restricting fault propagation to post 201 Ma (i.e. after tectonic quiescence) allows earlier extensional and contractional stages of deformation to be modeled on the same fault and an overall better model fit. Inconsistencies between model geometries and the original interpretation derive from assumptions in the modeling, such as planar depositional surfaces and a simplification of structural history not accounting for factors such as varying tectonic stress fields.
 Using Ages
Ordering model surfaces by age instead of depth allows for hangingwall surfaces to have footwall correlations that have been completely removed. This broadens capabilities to model regional erosion during structural development, truncation of hangingwall surfaces, and the reconstruction of eroded footwall stratigraphy.
Using cross-sectional thicknesses and ages of structural surfaces, burial history diagrams can be generated to display the complex depositional history of both the hangingwall and footwall. Above shows the burial history diagram of the footwall, which includes two eroded horizons with burial/ exhumation paths through time represented as the dashed lines in the diagram.
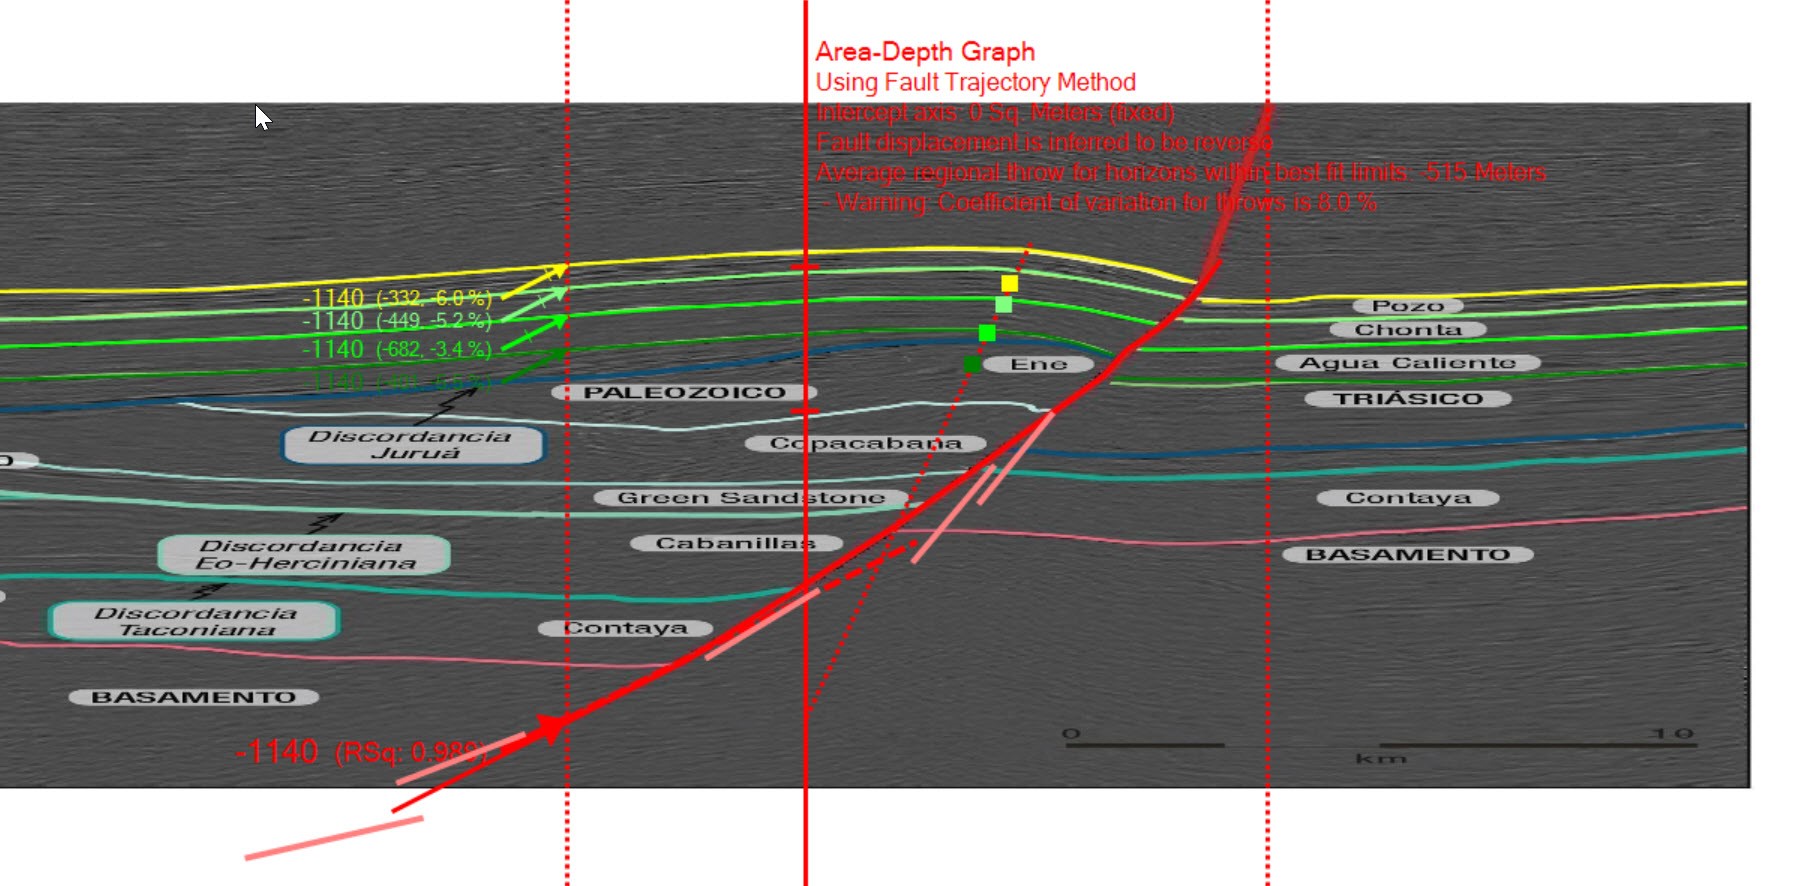
Area-Depth Fault Trajectory Method
The variation of fold area above regional with depth independently confirms the location of the upper fault segment as well as provides a constraint for extrapolating the fault at depth. This outline or fault trajectory “envelope” (orange line segments) was produced by changing the regional limits of area-depth graphs, a method outlined in Eichelberger et al (2017 AAPG Bulletin)
{


